
Case Study
Turning Complex Research into Usable Insight
My Role
Director, CX Design
Collage Group
Market Research & Consumer Insights
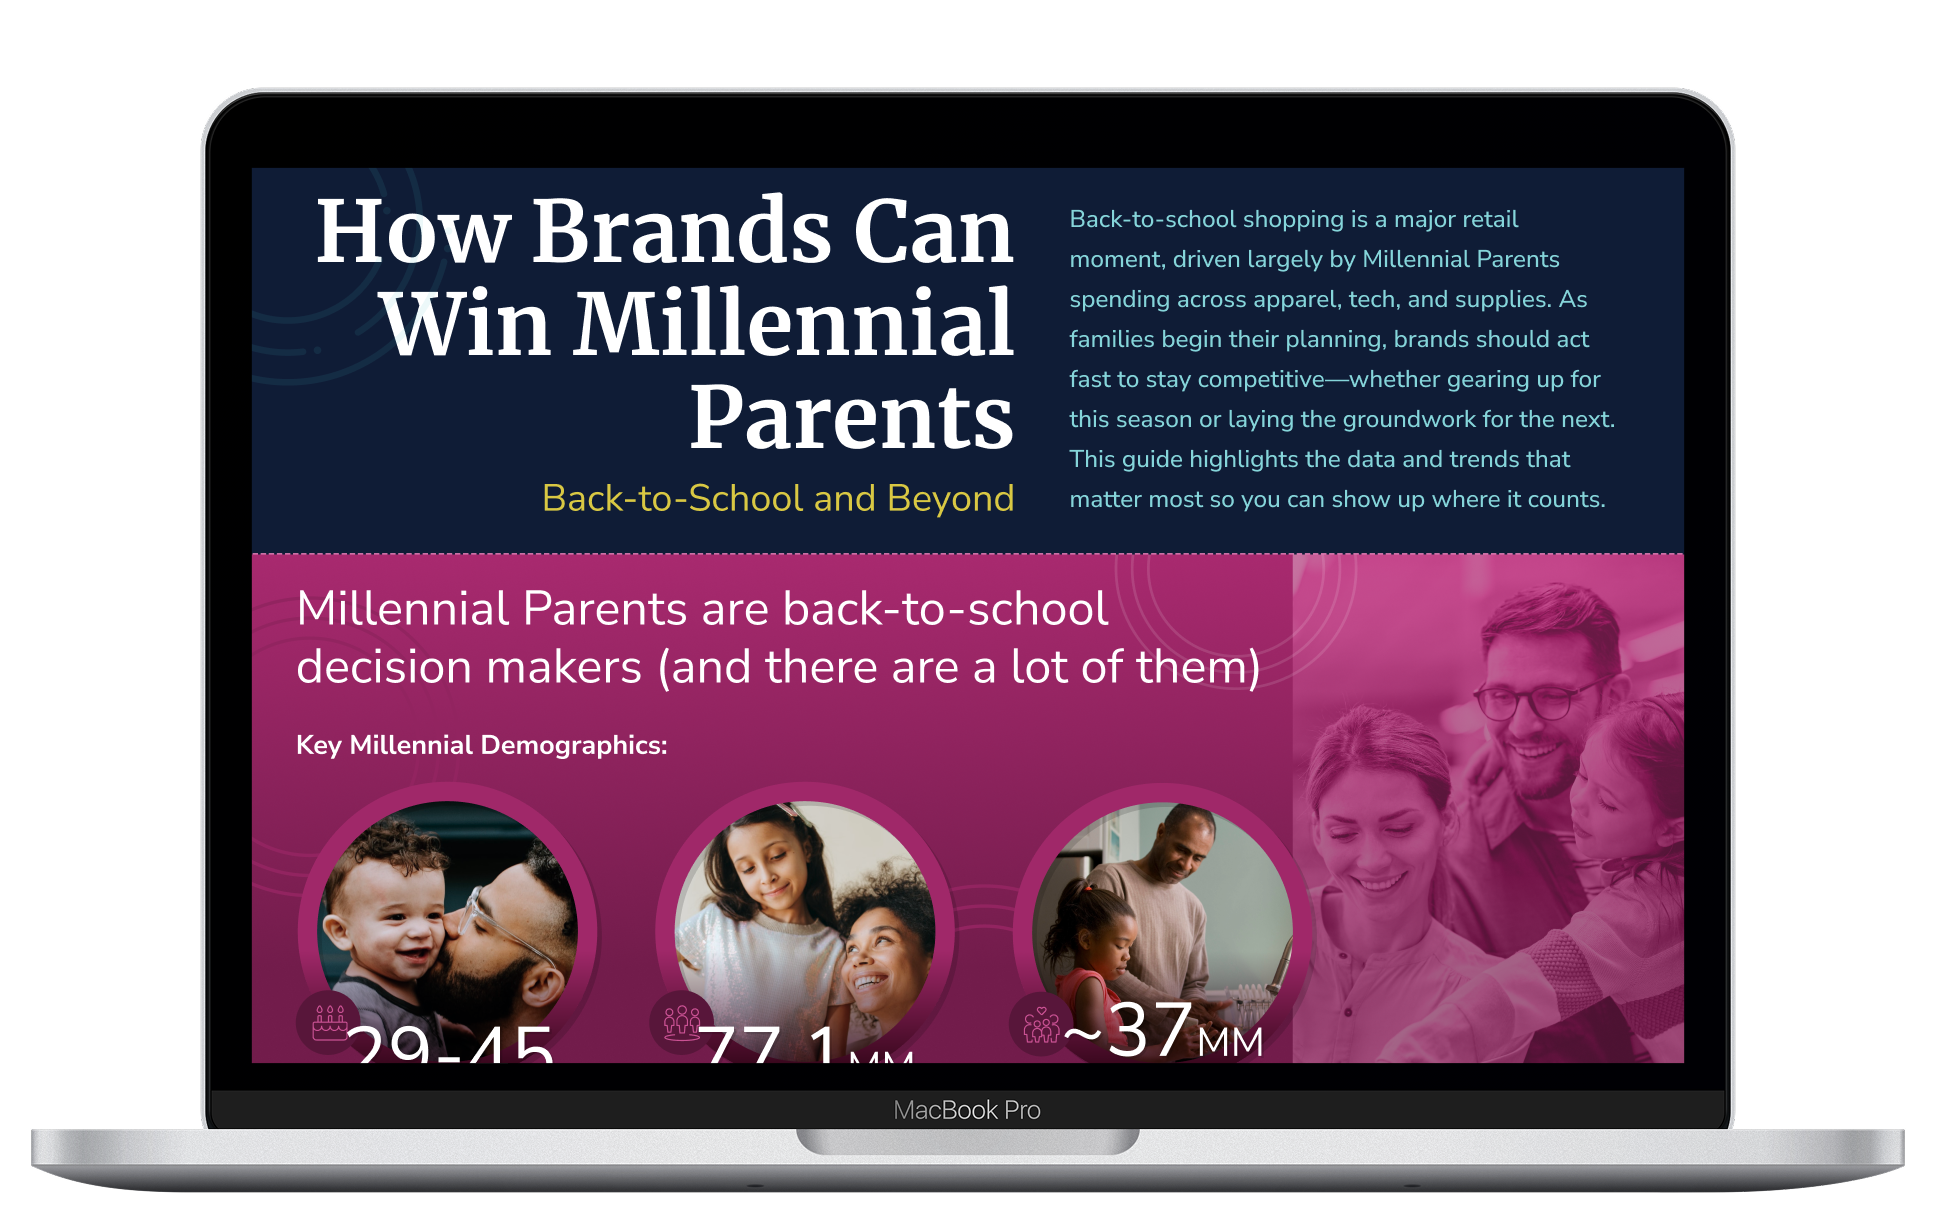
In collaboration with research analysts and content partners, I owned the transformation of raw market research into clear, editorial-quality infographics, bridging data analysis and visual storytelling.
CHALLENGE
When Complex Research Becomes Hard to See
The company’s market research team had accumulated a wealth of high-value data on diverse consumer segments. However, much of that insight lived in dense tables and functional charts—analytically sound, but difficult to interpret quickly and rarely leveraged as outward-facing content.
The challenge was to unlock the value of this data by transforming it into assets that were engaging, accessible, and market-ready, while preserving the rigor and nuance behind the research.
Approach
Shaping Research into Reusable Visual Storytelling
The infographics were designed as a system for translating research into scalable, market-ready content. Each step balanced analytical rigor with visual clarity, with close collaboration between design and research to ensure accuracy and relevance.

Insight Prioritization
Research outputs were reviewed in partnership with research analysts to understand the context, nuances, and intended takeaways behind the data. Key insights were then prioritized based on relevance to external audiences, ensuring the final visuals highlighted the most meaningful findings without overwhelming viewers.

Data-to-Design Translation
Dense tables and charts were restructured into clear visual narratives. Based on analyst-reported findings, the data was simplified into intuitive comparisons and hierarchies, using layout, typography, and color to guide interpretation while preserving analytical integrity.

Scalable Visual Systems
Infographic components were designed to be flexible and reusable across datasets and campaigns. Consistent visual patterns, iconography, and typographic scales enabled efficient production of new content while maintaining cohesion across marketing and thought-leadership materials.
Results & Impact
From Insight to Scalable Marketing Assets
The redesigned infographics transformed existing research into versatile, high-value visual assets. By improving clarity and reusability, the work increased both the accessibility and the long-term value of the data.

Multi-Campaign Reuse
The visuals were deployed across multiple marketing campaigns, maximizing reach without requiring new data collection.

Extended Data Lifespan
Existing research was repurposed into reusable infographics, allowing insights to live beyond static reports, and increasing the long-term ROI of existing data.

Improved Comprehension
Complex findings became easier to understand at a glance through clear visual hierarchy and storytelling, allowing audiences to absorb key insights more quickly.

Market-Ready Assets
Delivered polished, flexible visuals that supported thought leadership, campaign execution, and audience engagement across channels.
CASE STUDY
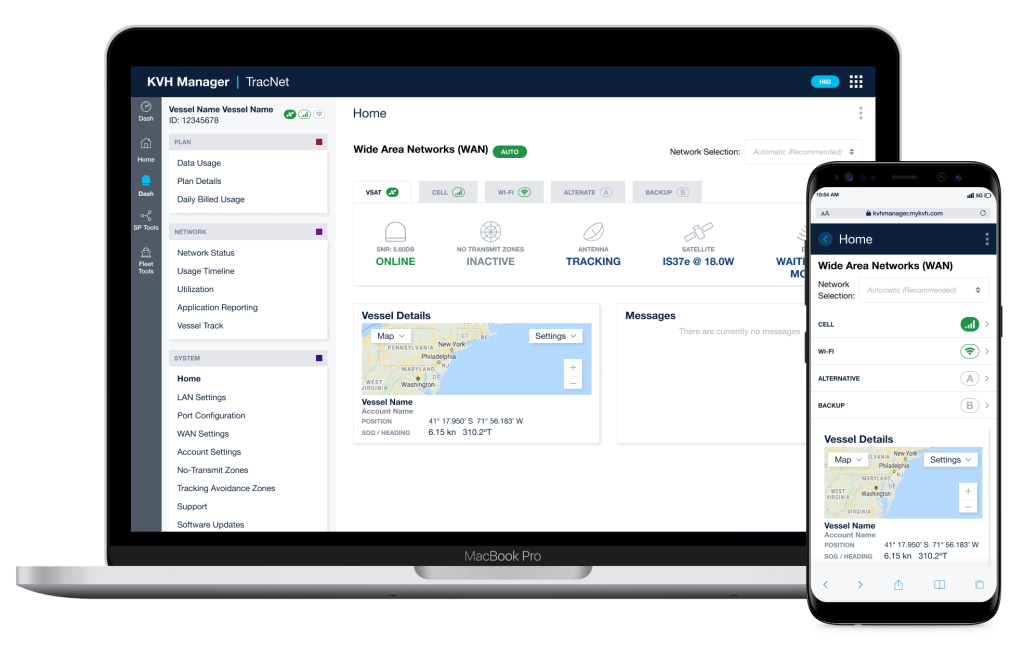
A Scalable UI Redesign for Satellite Comms Systems
A scalable UI redesign bringing clarity and control to a complex satellite communications platform.