Key insights identified and reorganized into a clear, story-driven structure.
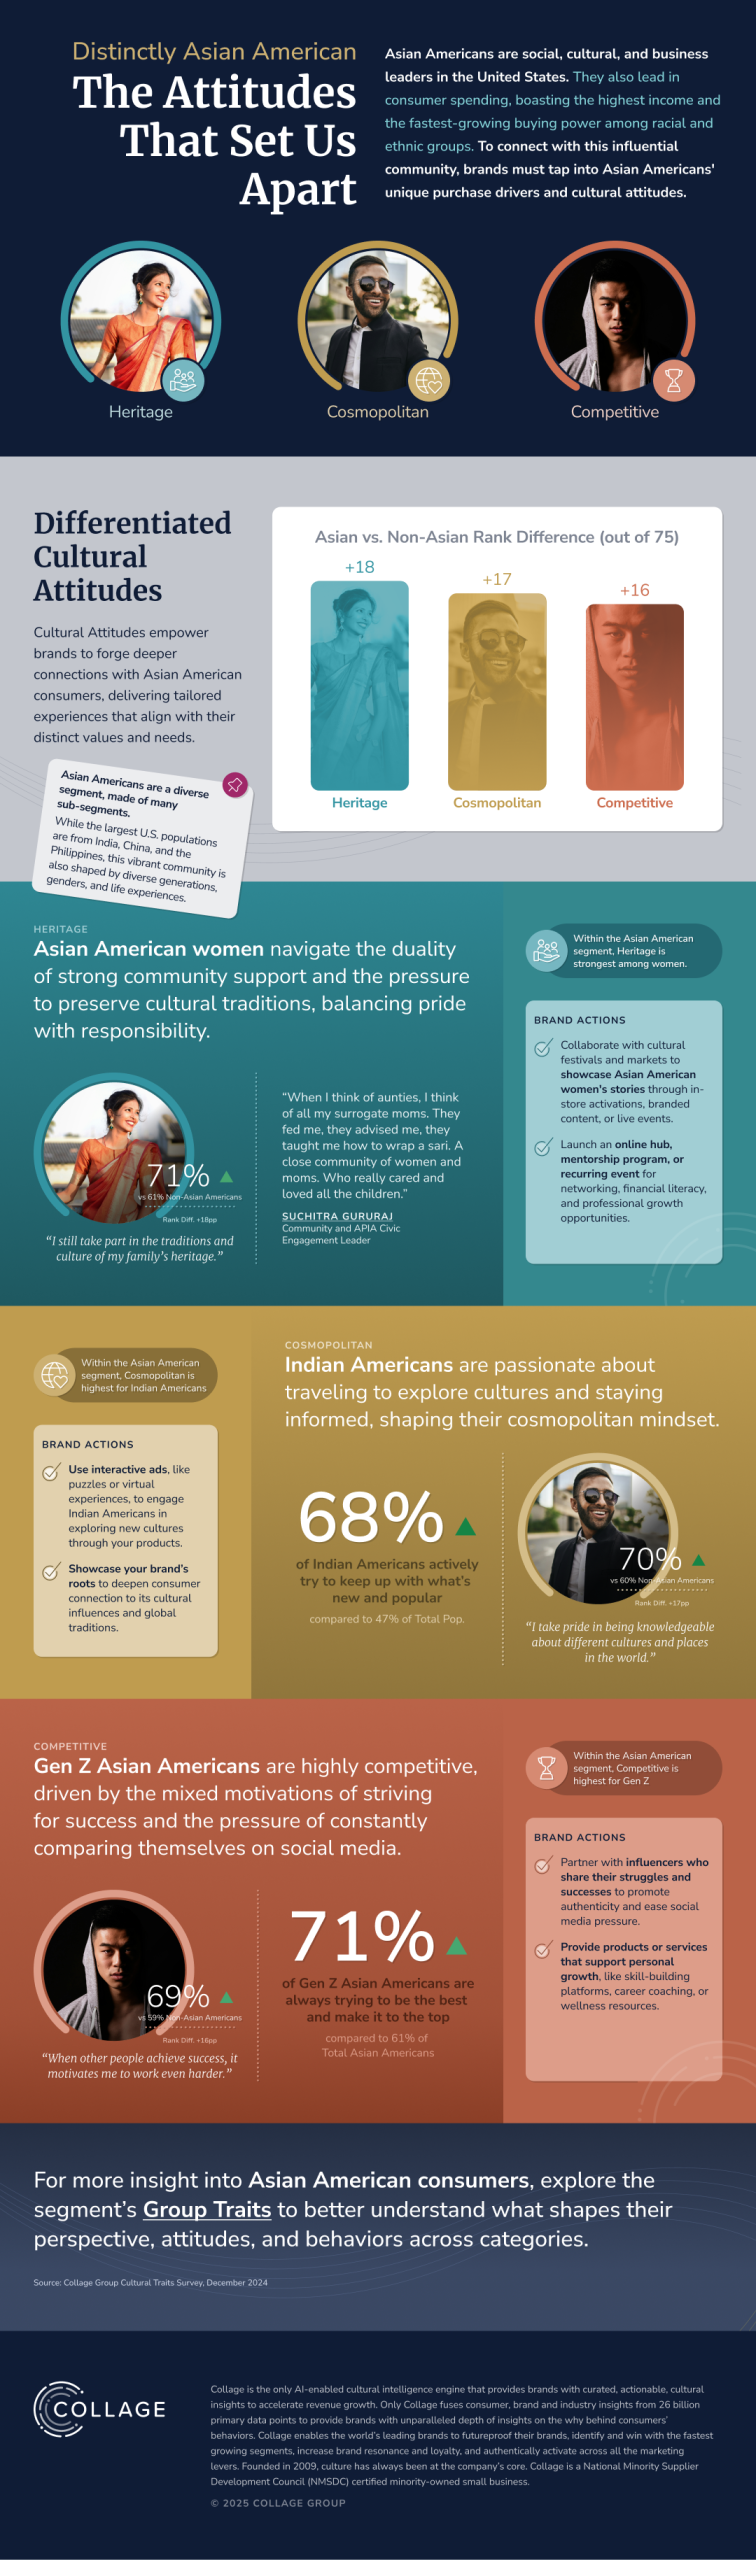
Dense tables translated into visuals that make patterns and relationships immediately clear.
Complex research findings translated into a clear, visual narrative that prioritizes readability and insight.
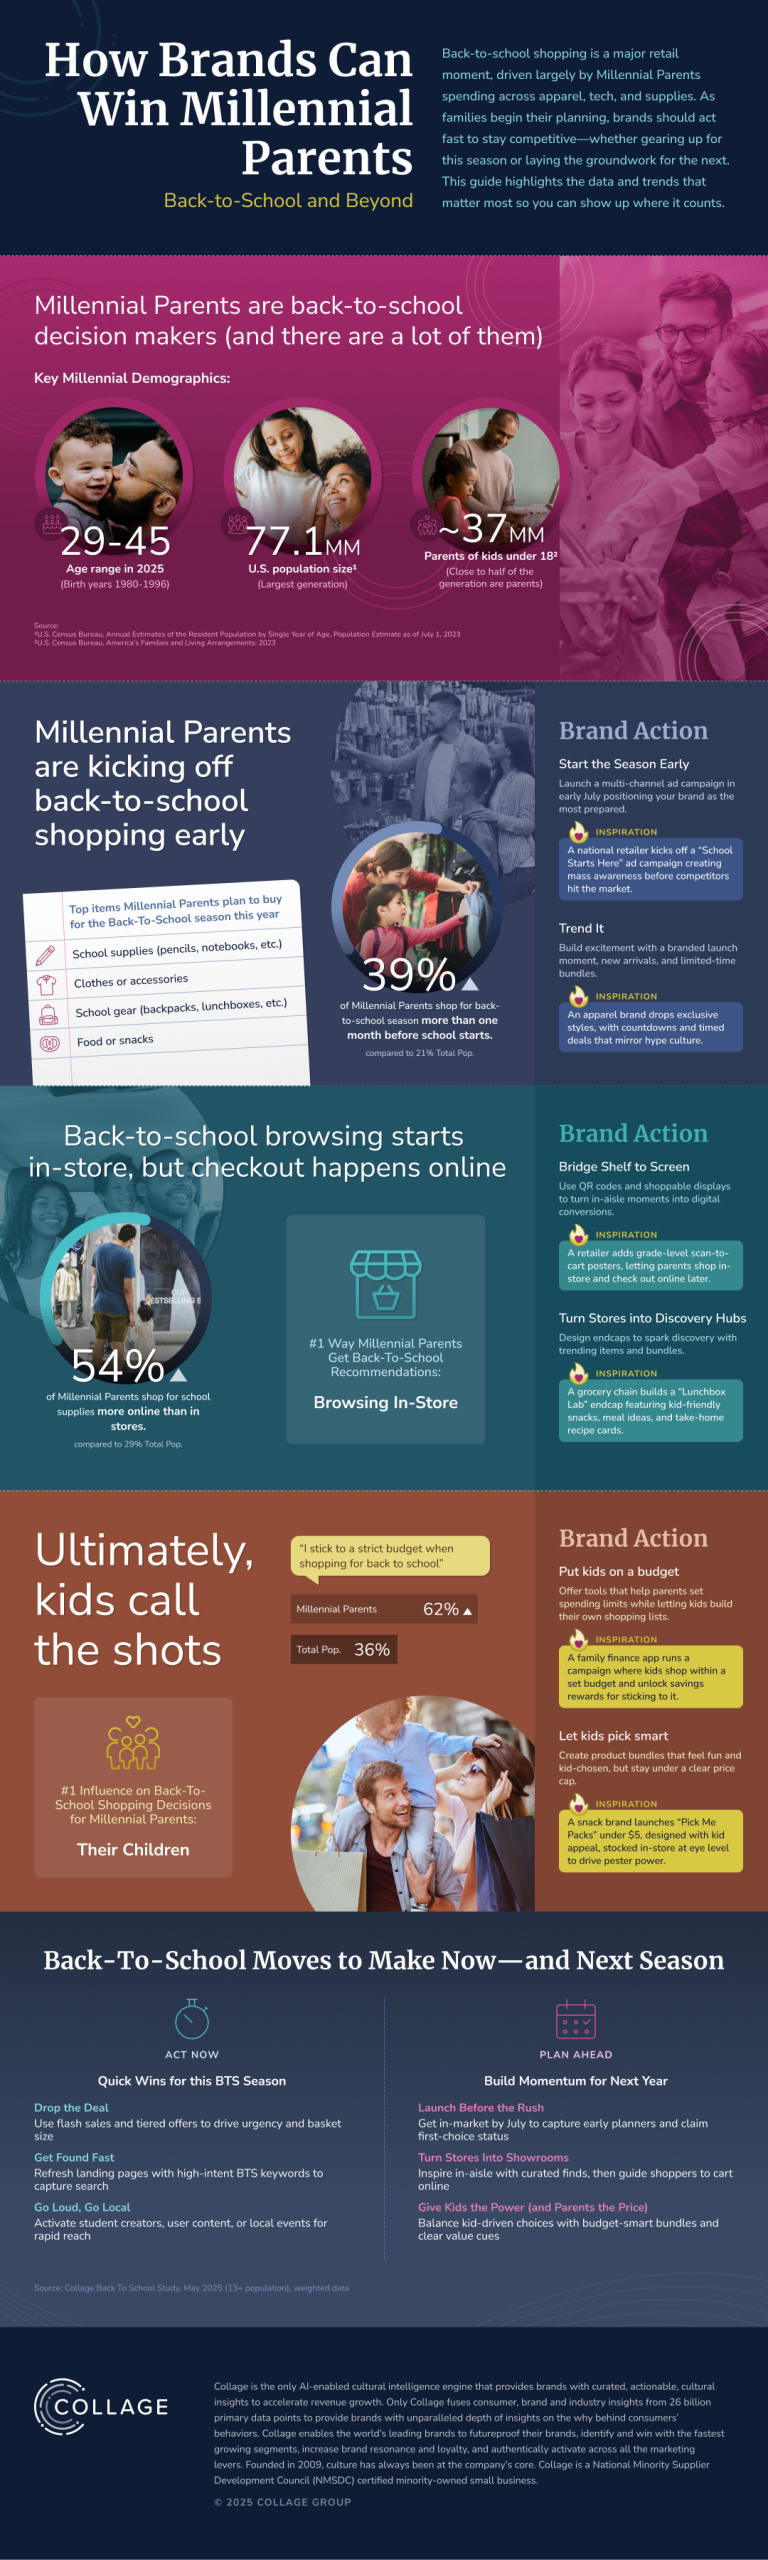
Visual hierarchy and storytelling guide the viewer through key findings without sacrificing analytical accuracy.
A reusable infographic format that supports clarity, consistency, and multi-channel distribution.